
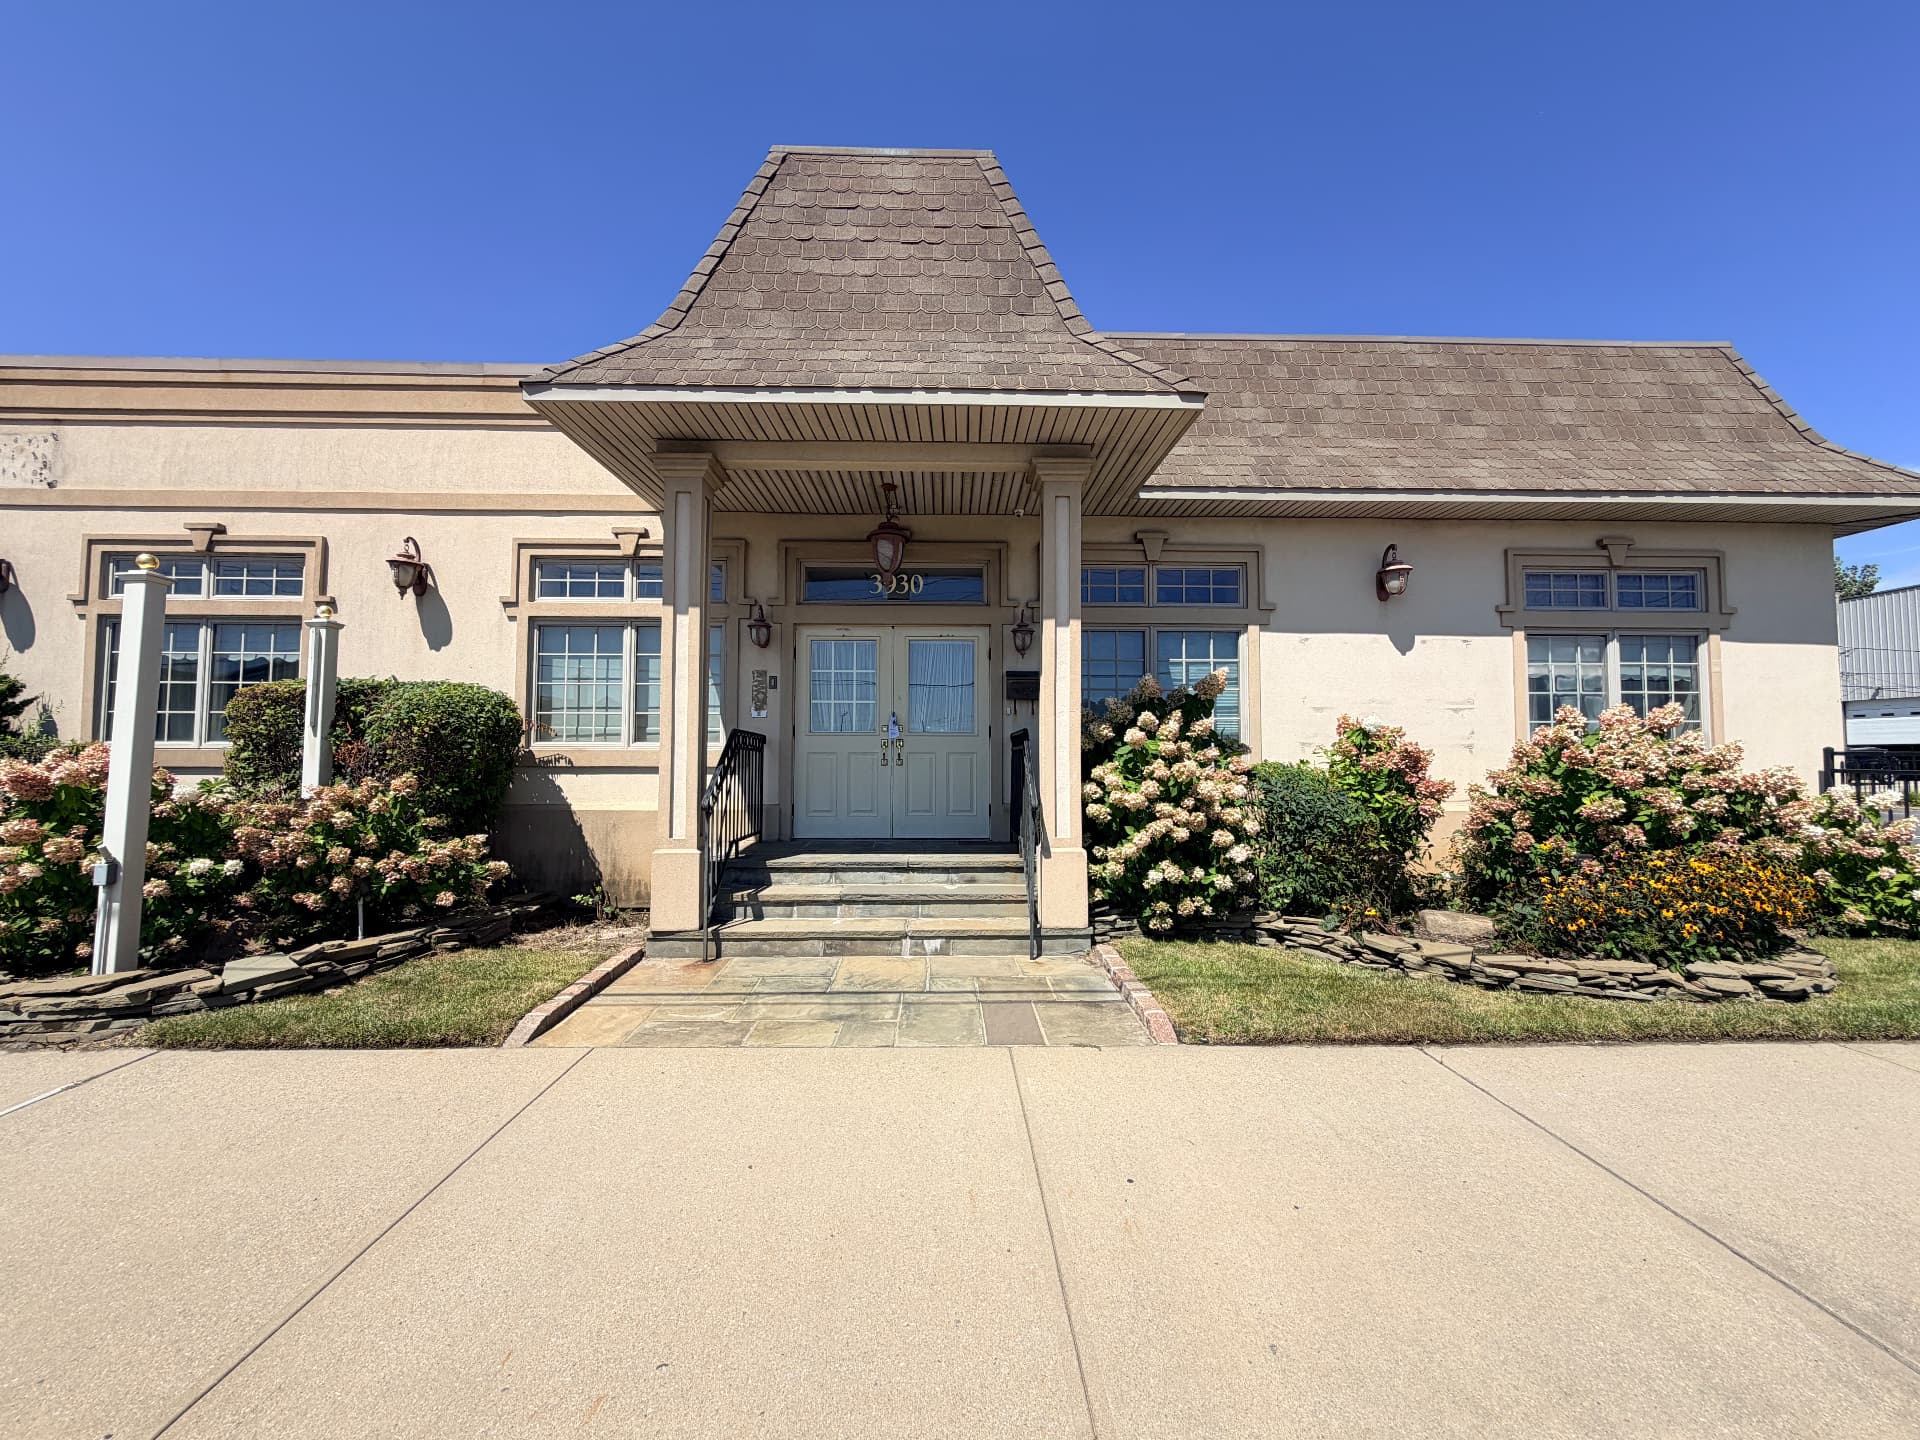
Island Park, NY · Private development model
3930 Long Beach Road
Current condition: former funeral home, pre-renovation. Below, every assumption is adjustable and the numbers update as you move.
- Total building
- 10,000 SF
- Floors
- 2 × 5,000 SF
- Suites planned
- 35
- Parking
- 50 spaces
Walk the site
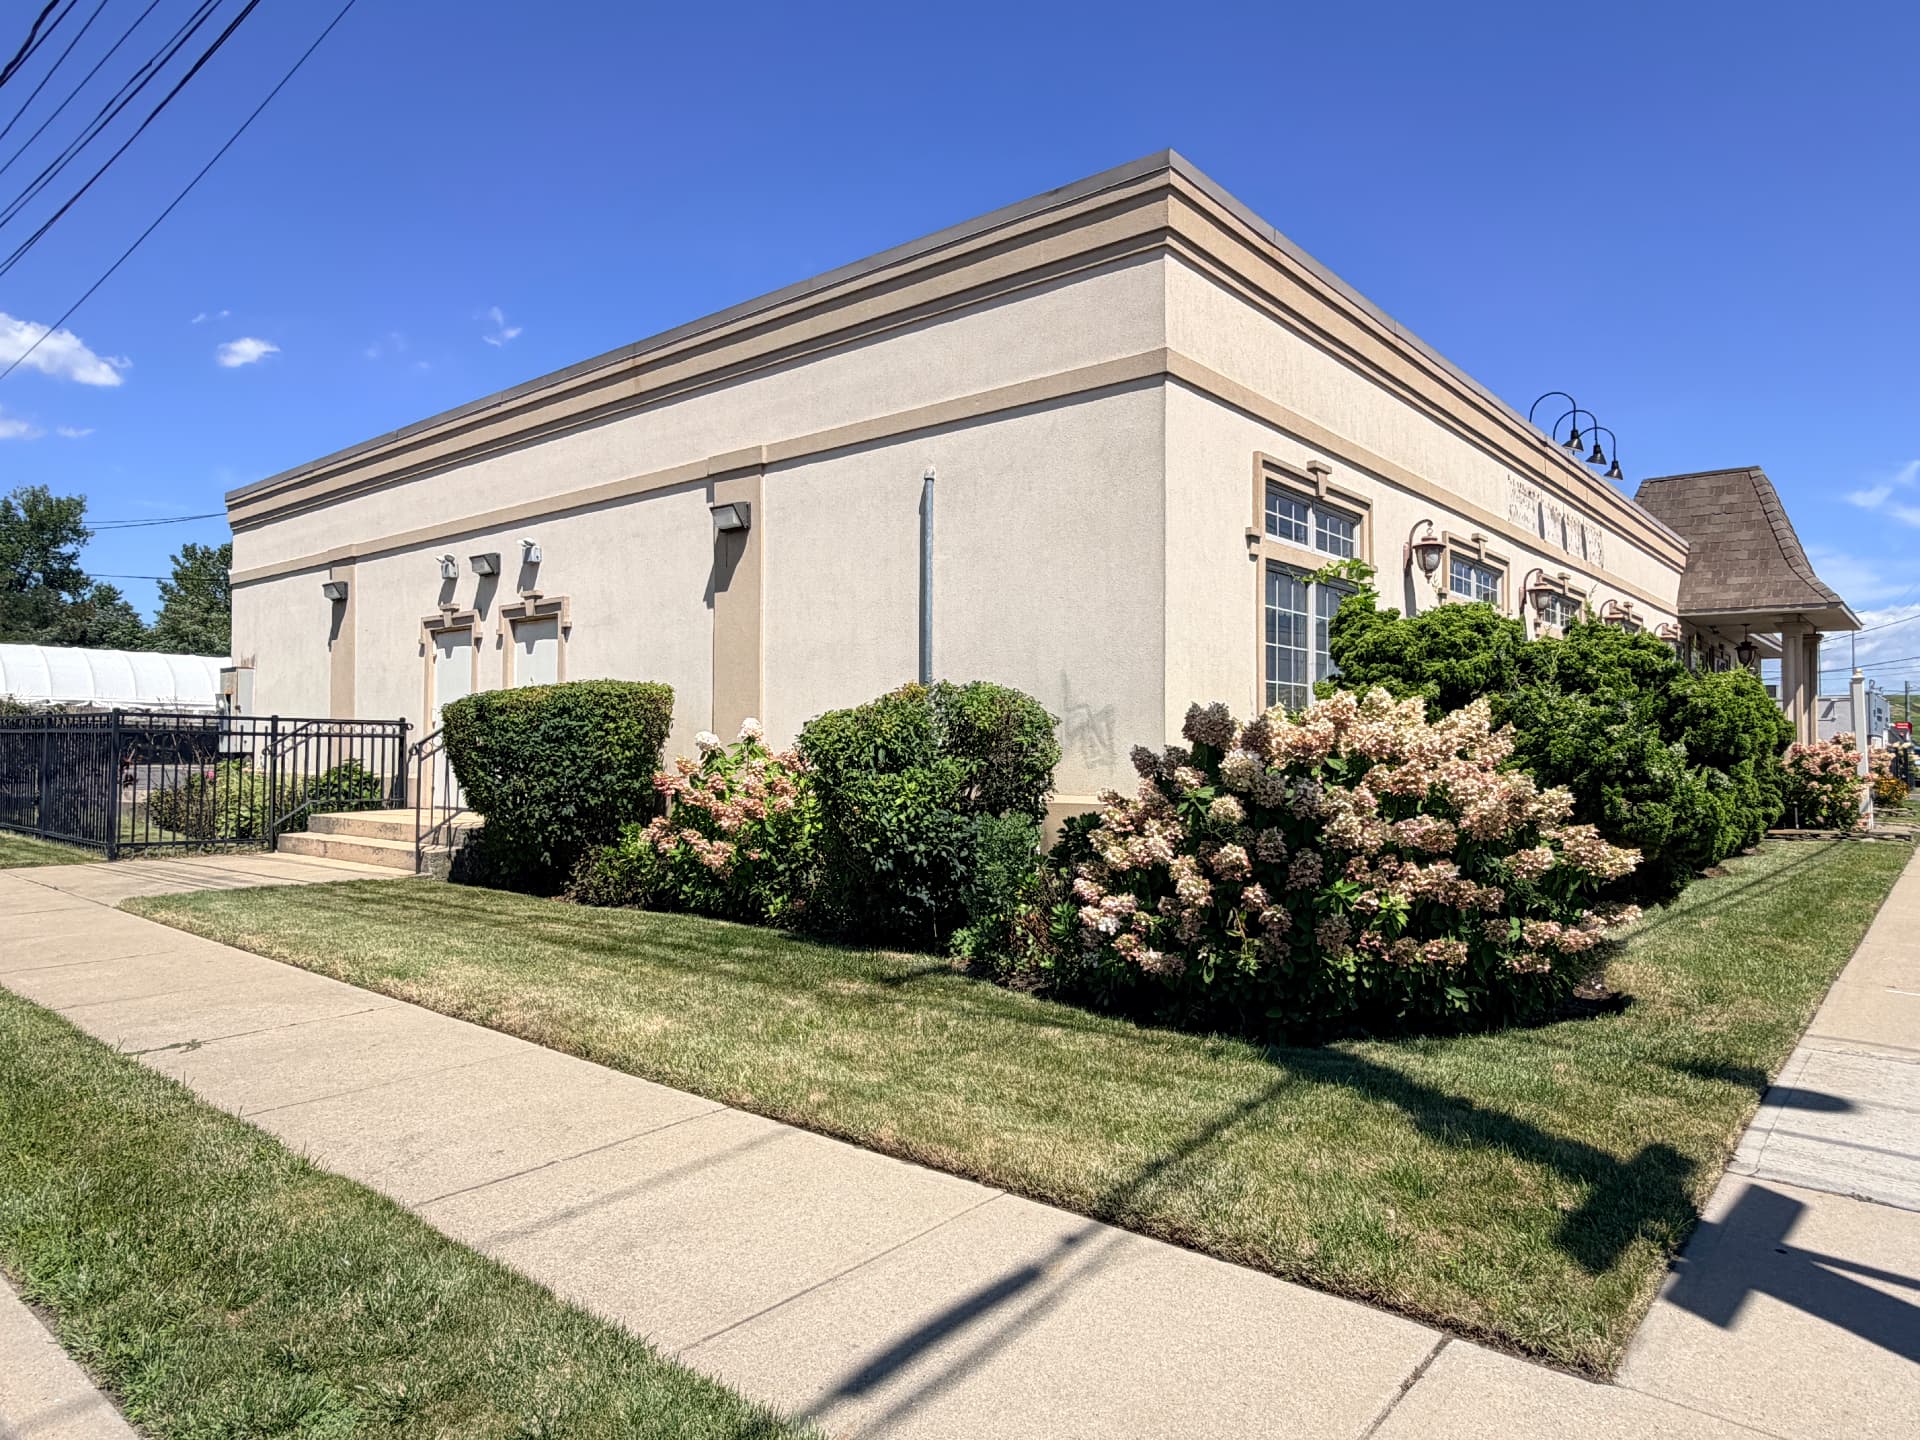
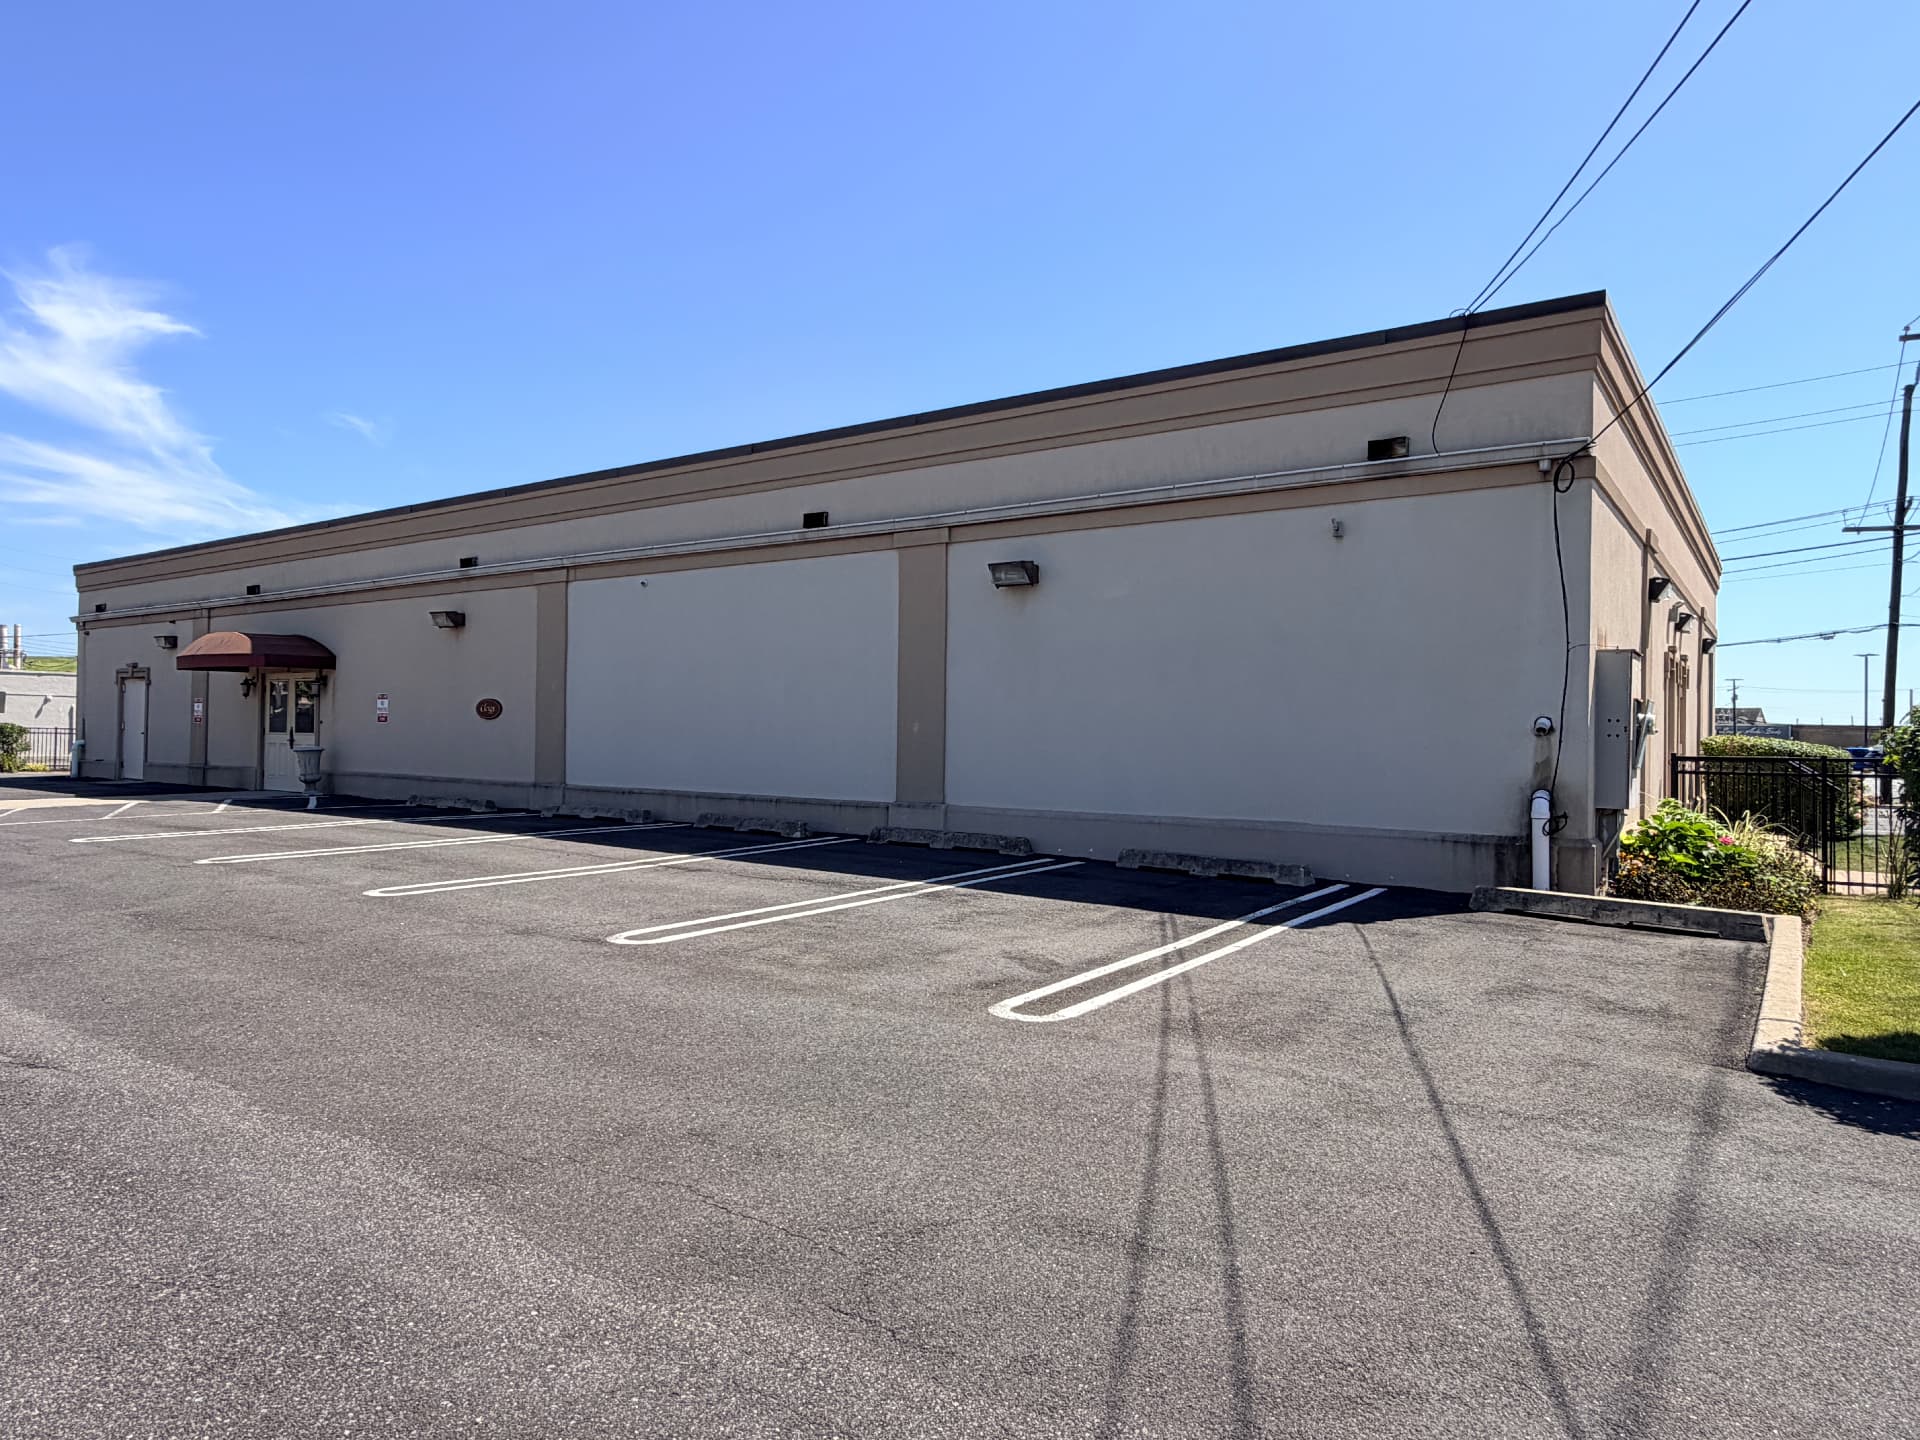
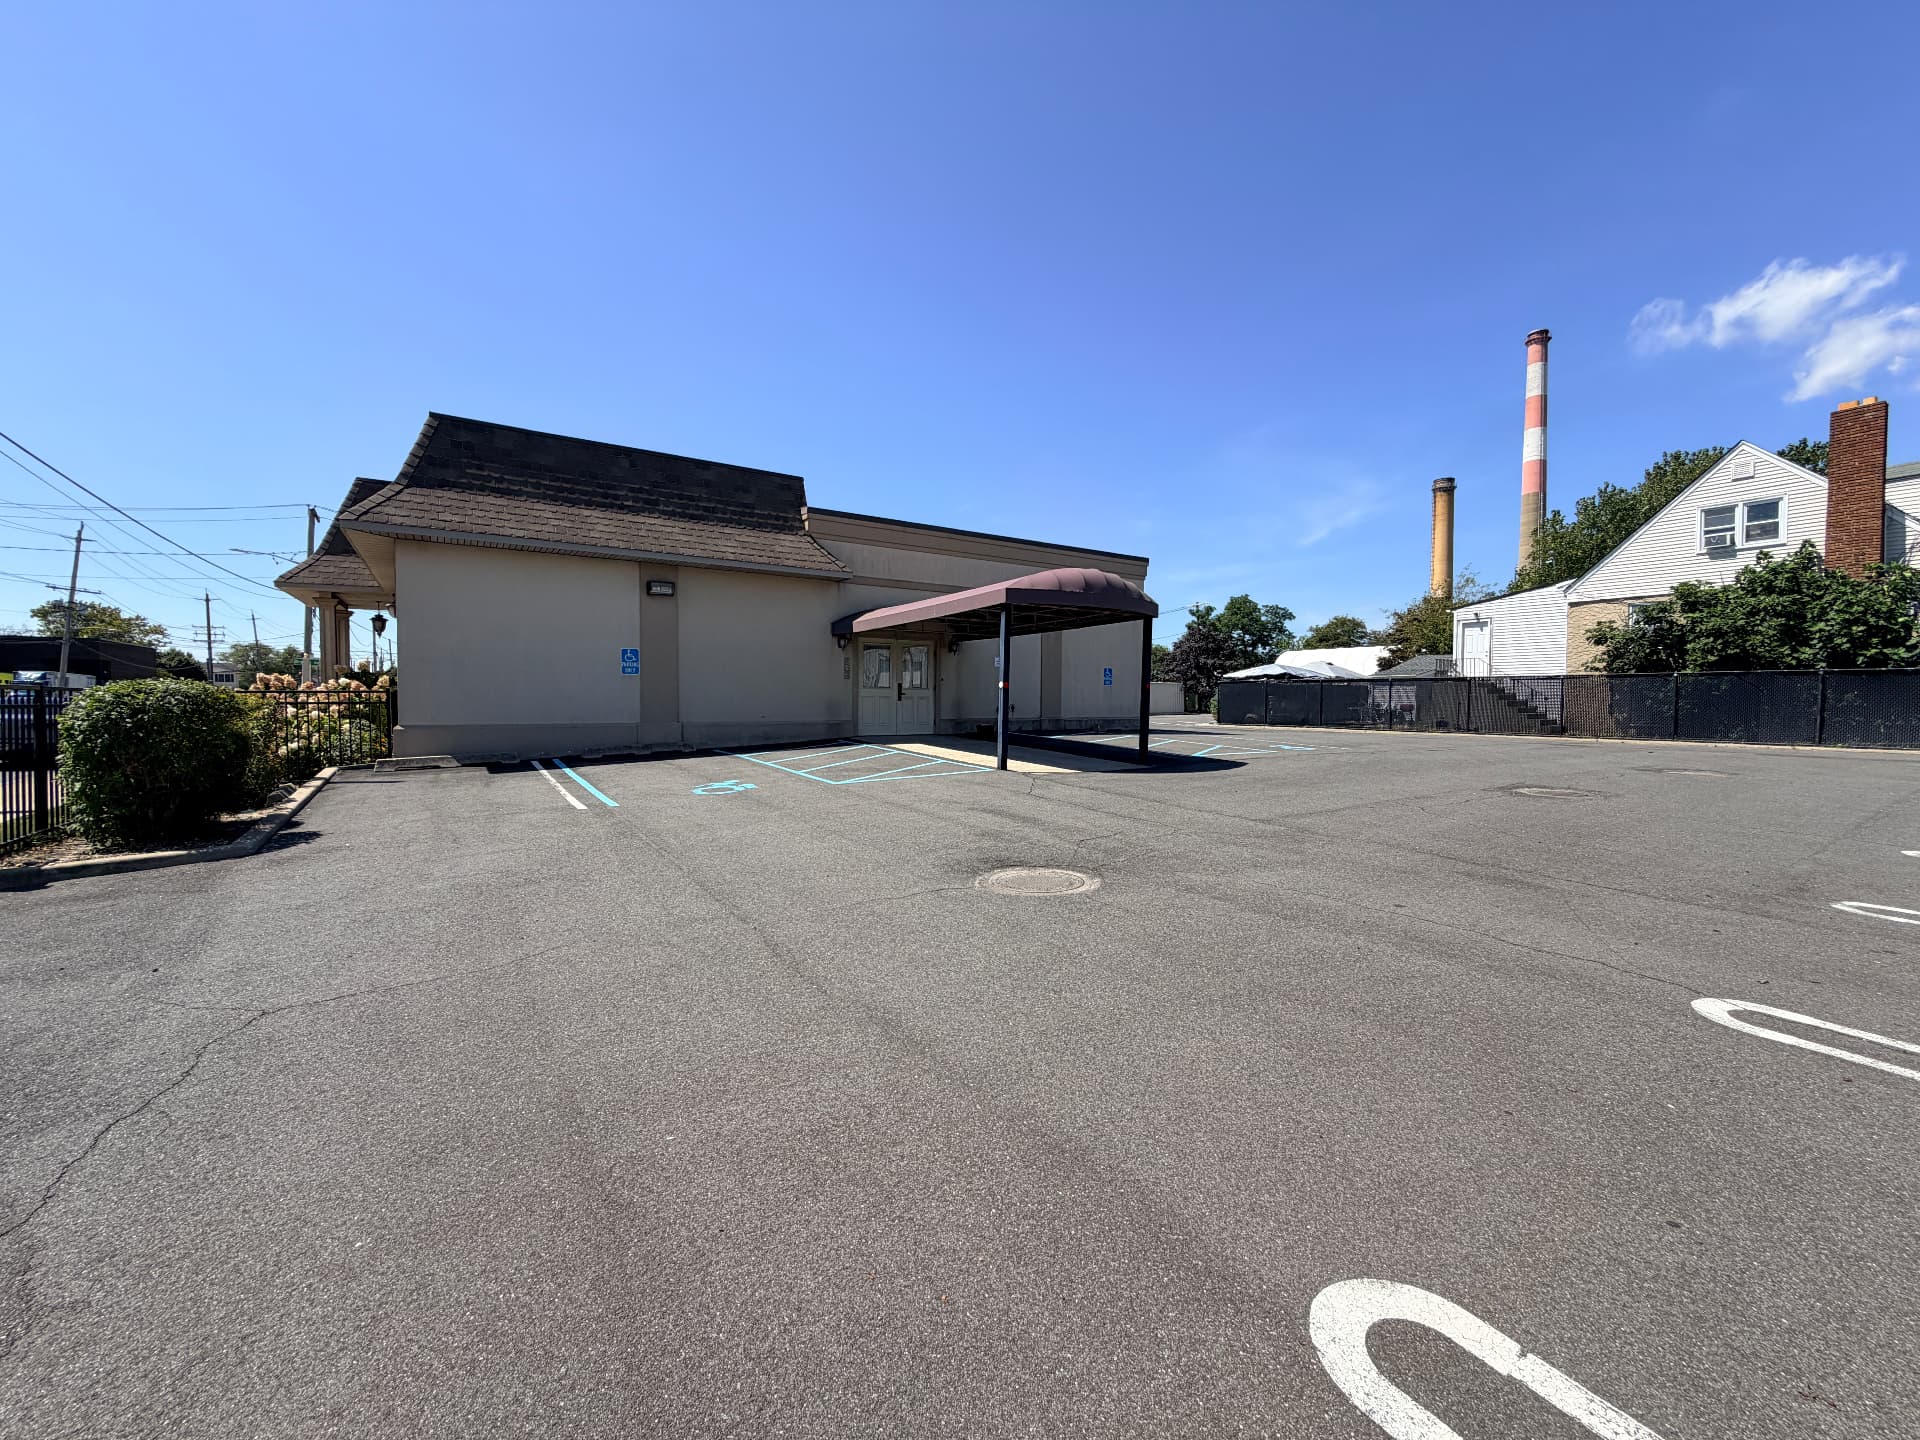
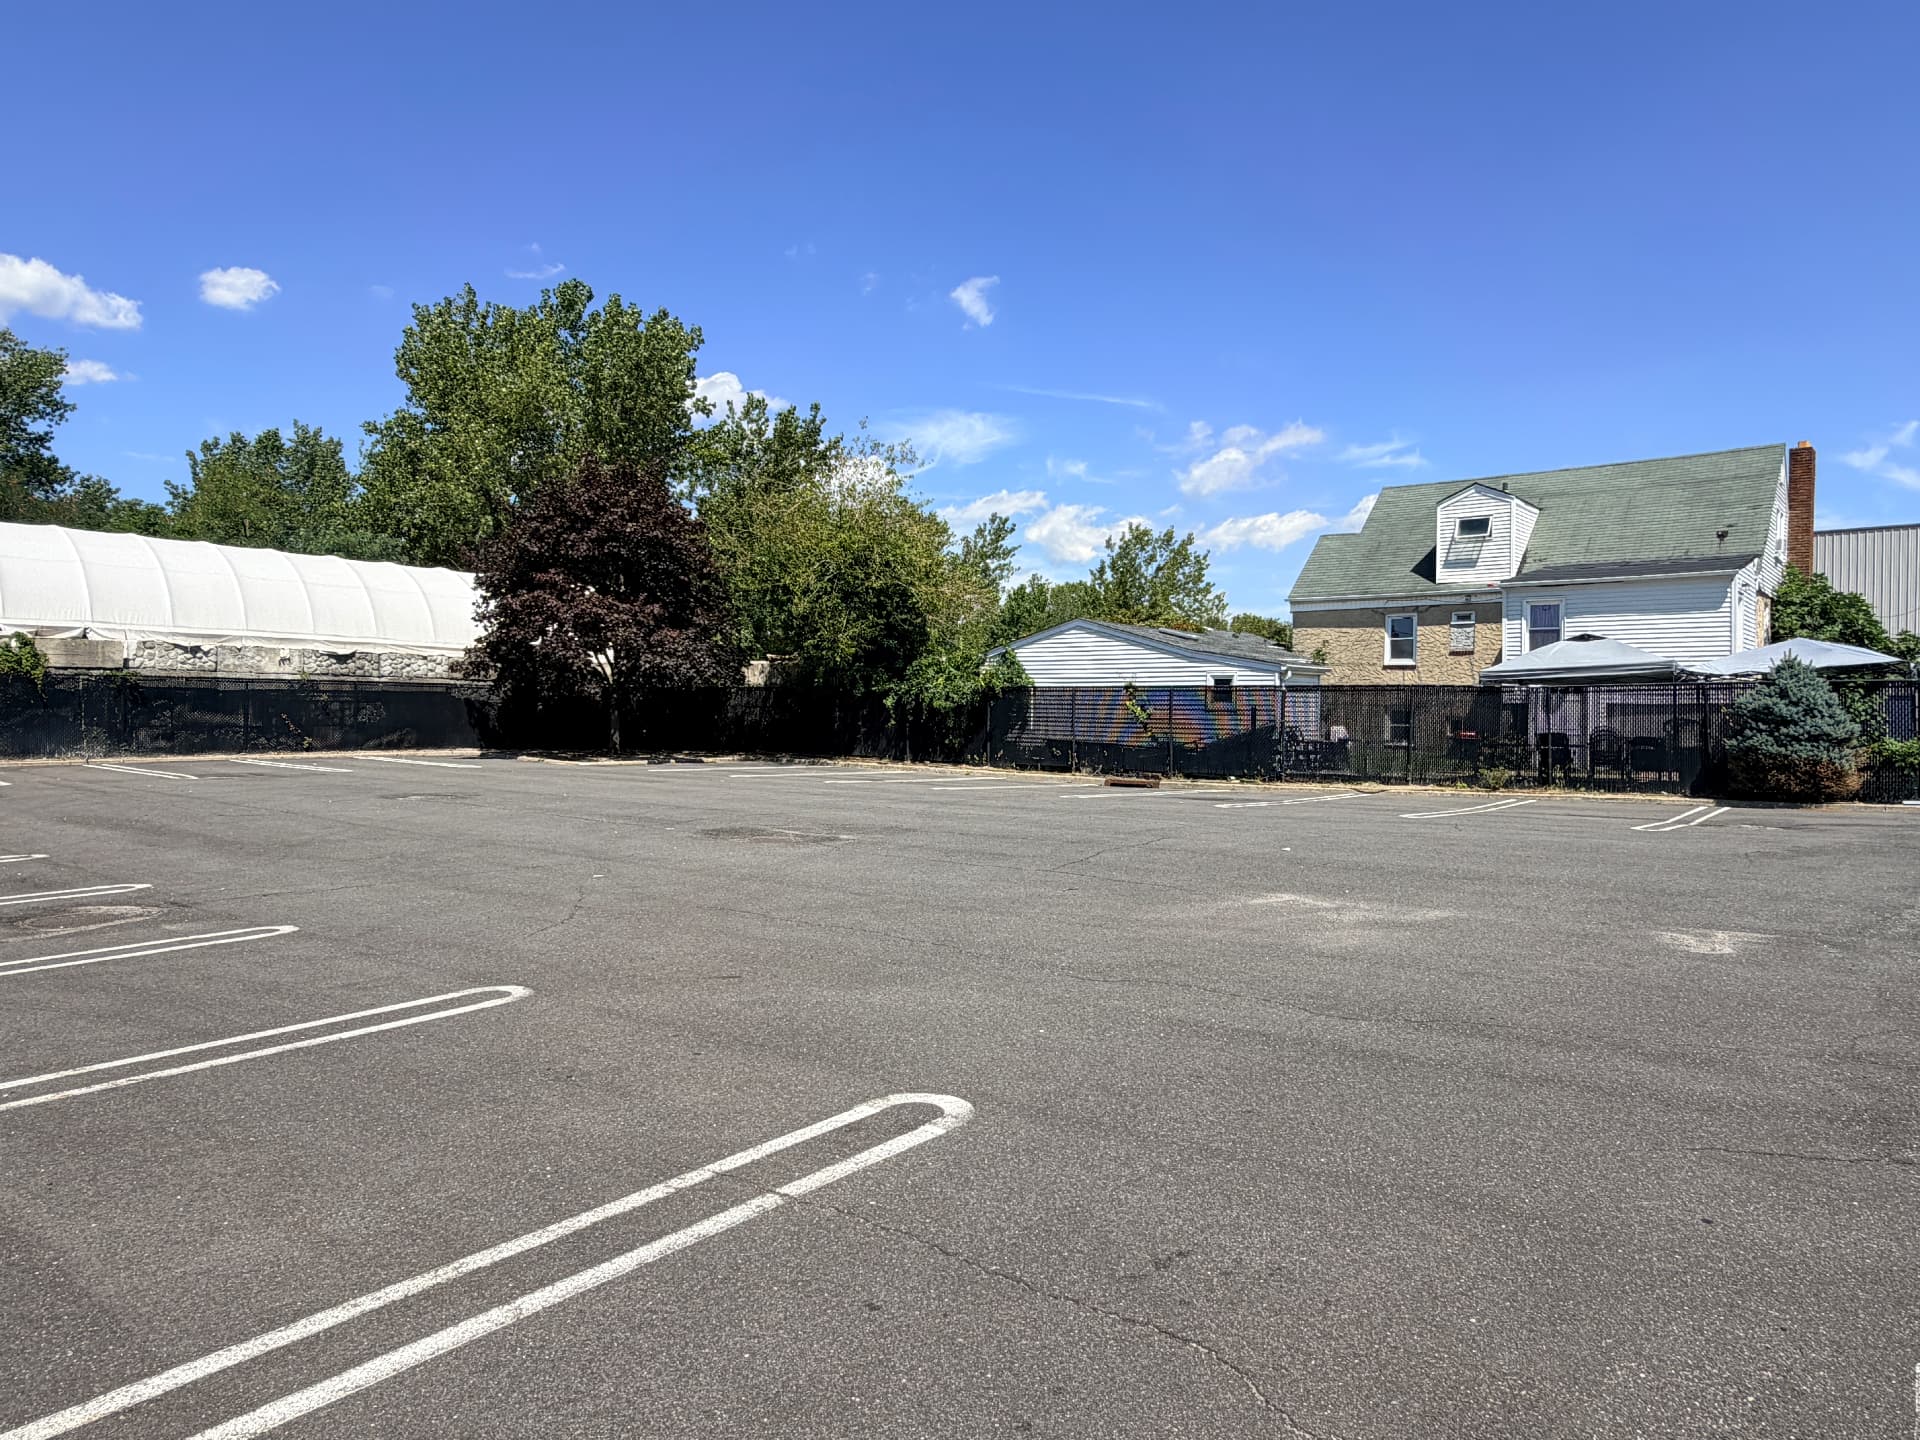
Current condition, photographed on site — building, frontage and the full rear parking lot.
What this project returns
Four numbers that tell you whether the plan works. Everything else on this page feeds into them.
At full occupancy, sold on an 8.0% cap rate
- NOI at full occupancy
- $370,075
- All-in cost
- $2,235,000
- Gain over cost
- $2,390,938
Jump to a preset set of assumptions.
A one-page PDF of these exact numbers — clean, ready to send or print.
Adjust the assumptions
Move any slider on the left and the charts on the right recalculate instantly.
Total Investment
What you paid for the building plus the second-floor build-out.
Second Floor Build-Out — Income
35 private practice suites, all-in rent = base rent + flat utility fee.
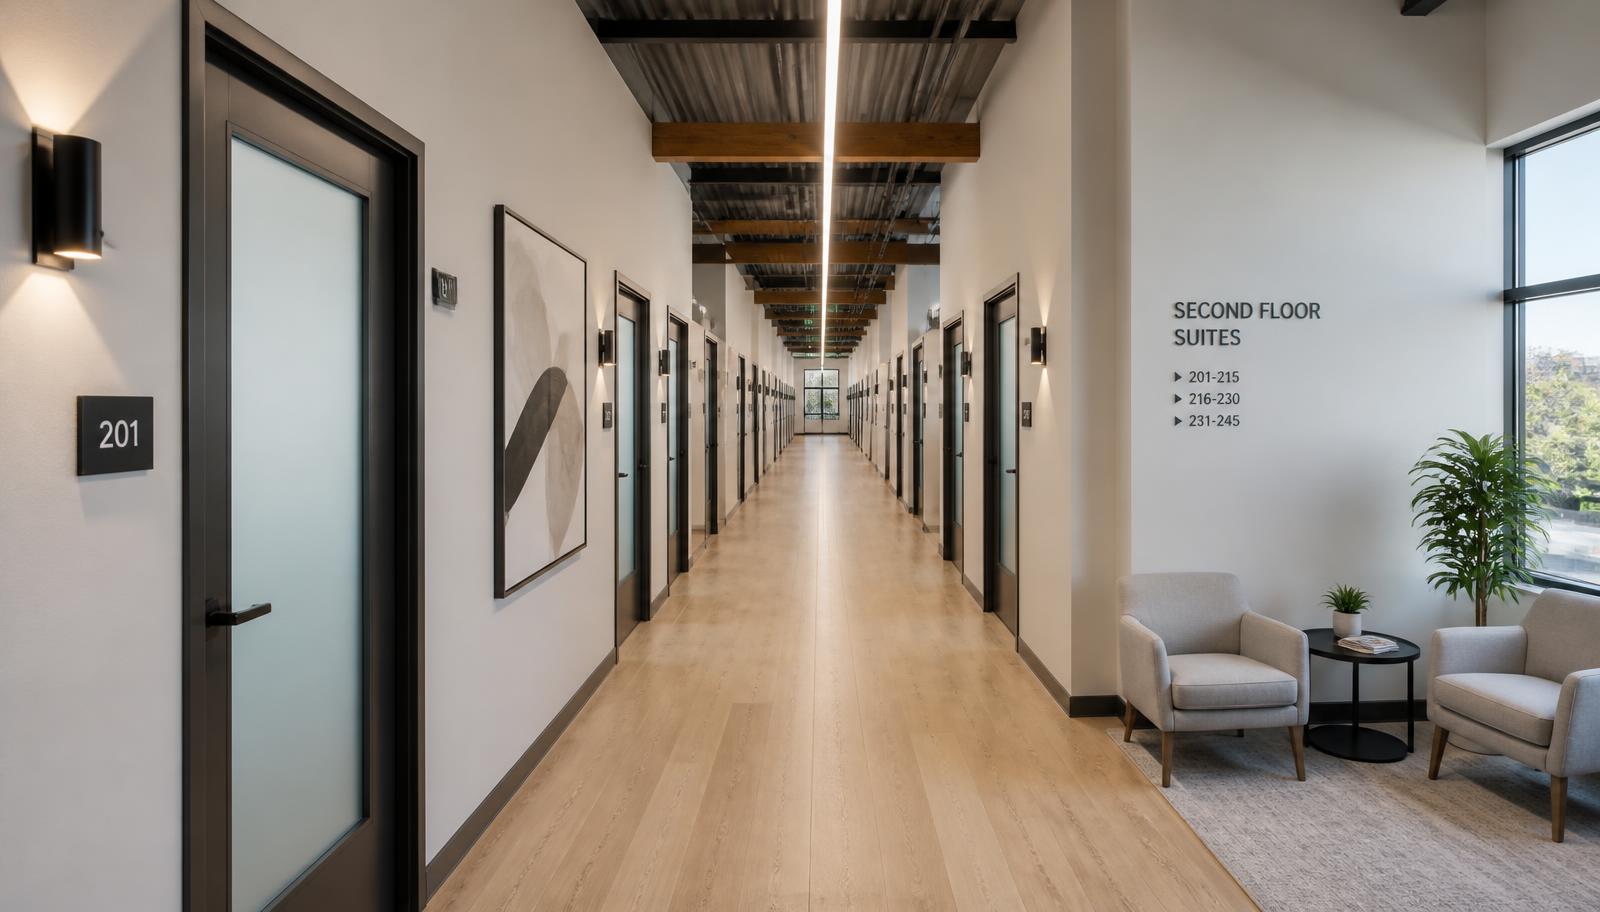
Concept rendering — second floor
Building fits 35 suites at most
All-in rent: $1,125/month per suite
How this compares to the market
- Comps for micro-suites are thin
- There isn't a deep, established market for this exact product — small private- practice suites of roughly 150 SF or less. Treat any figure below as directional, not a tight benchmark.
- Where micro-unit comps do exist
- Small units up to ~150 SF typically run $85–$110 per SF per year — noticeably higher per SF than standard office, because the fixed cost of building out many small rooms (doors, plumbing and electrical stubs, HVAC zoning) is large relative to the square footage.
- Quick math check on this building
- The second floor averages 5,000 SF ÷ 35 suites ≈ 143 SF per suite. At the current $975/mo base rent that's about $82/SF/yr — right at the low end of the $85–$110/SF micro-unit range, so the base-case rent assumption is reasonable but not aggressive.
- Medical / professional office cap rates, 2026
- Roughly 6.5%–8.5% for stabilized suburban assets — cap rates are driven by the building and income profile, not unit size, so this range still applies. Smaller secondary-market buildings like this one typically trade toward the wider, higher end of it.Source: CREG Healthcare and Sorso 2026 medical office cap rate reports
- Sanity check before you commit
- The assumed $150–$300/SF build-out and the exit cap rate used here should both be checked against the $85–$110/SF micro-unit rent range and the cap rate range above — and because New York often reassesses property tax on a sale or transfer, confirm the tax line with the town assessor before finalizing.
Operating Expenses
$90,000 per year — set to $0 for an all-cash purchase
Rooftop Space
Undeveloped roof leased out for a fixed monthly rent.
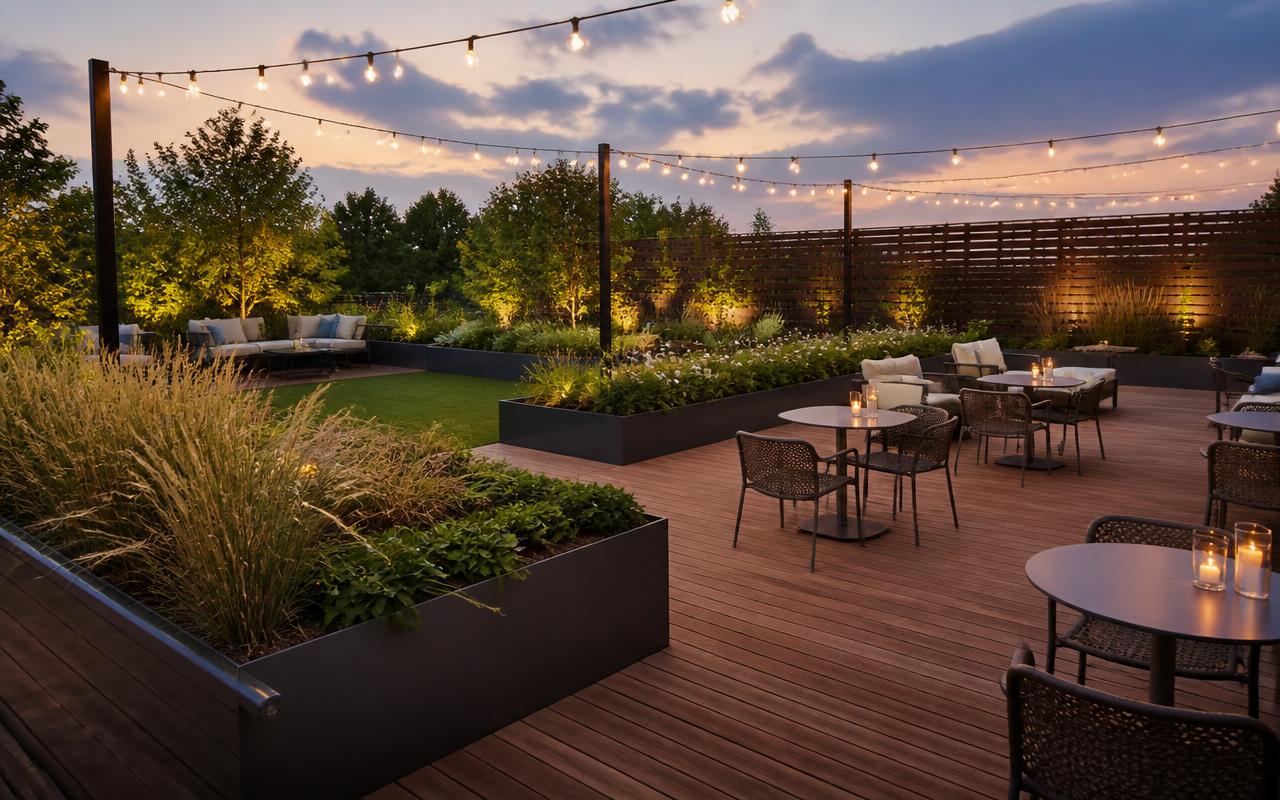
Concept rendering — rooftop
Parking Income
Lease out spare parking spots by the month.
Rear lot as it stands today
Lot fits 50 spots at most
Adds about $28,500 to yearly profit after its share of costs.
Brokerage & Leasing Fees
Commissions paid to brokers to fill the suites — a bigger one-time cost to lease up the building, then a smaller yearly cost as tenants turn over.
Counted as part of your total investment, not a yearly expense.
Ongoing operating expense as suites re-lease.
Income → Expenses → NOI
Cap Rate
Sensitivity — how much cushion
Cap rate if rent or vacancy moves against you. Everything else stays as set.
| Rent \ Vac | 3% | 5% | 8% | 12% | 18% |
|---|---|---|---|---|---|
| $875 | 14.2% | 13.9% | 13.3% | 12.6% | 11.5% |
| $925 | 15.1% | 14.7% | 14.1% | 13.4% | 12.2% |
| $975 | 16.0% | 15.6% | 15.0% | 14.1% | 12.9% |
| $1025 | 16.8% | 16.4% | 15.8% | 14.9% | 13.7% |
| $1075 | 17.7% | 17.2% | 16.6% | 15.7% | 14.4% |
Cap rate at each combination of base rent per suite (rows) and vacancy (columns). The outlined cell is today's setting — 5% vacancy at $975/mo. Darker shading = stronger return.
Where the money goes
- Mortgage payments$90,000
- Property tax$50,000
- Insurance$14,000
- Common-area utilities$24,000
- Management fee$28,744
- Repairs & reserves$10,500
- Leasing commissions$10,000
Occupancy ramp & break-even
Break-even is the occupancy where cash flow hits zero.
Break-even occupancy is the share of the 35 suites that has to be leased and paying before the building covers its fixed costs (taxes, insurance, common-area utilities, reserves, leasing fees), the mortgage line, and the variable expenses that scale with rent collected. Rooftop and parking income count first, so they lower the bar the suites have to clear.
At today's settings you break even at 18% occupied and stabilize at 95% — a 77-point cushion, or roughly 27 of 35 suites that could sit empty and still leave you whole. The ramp reaches stabilized occupancy in month 6.
Financing & debt service
If you borrow instead of paying cash, this is what the bank looks at and what you keep.